Adding Extra Info on Plotly Charts on Hover
Plotly is my goto library when it’s time to create visualizations. Its a very easy to use high level library with an array of customization’s.
Creating a chart is as simple as
var data = [
{
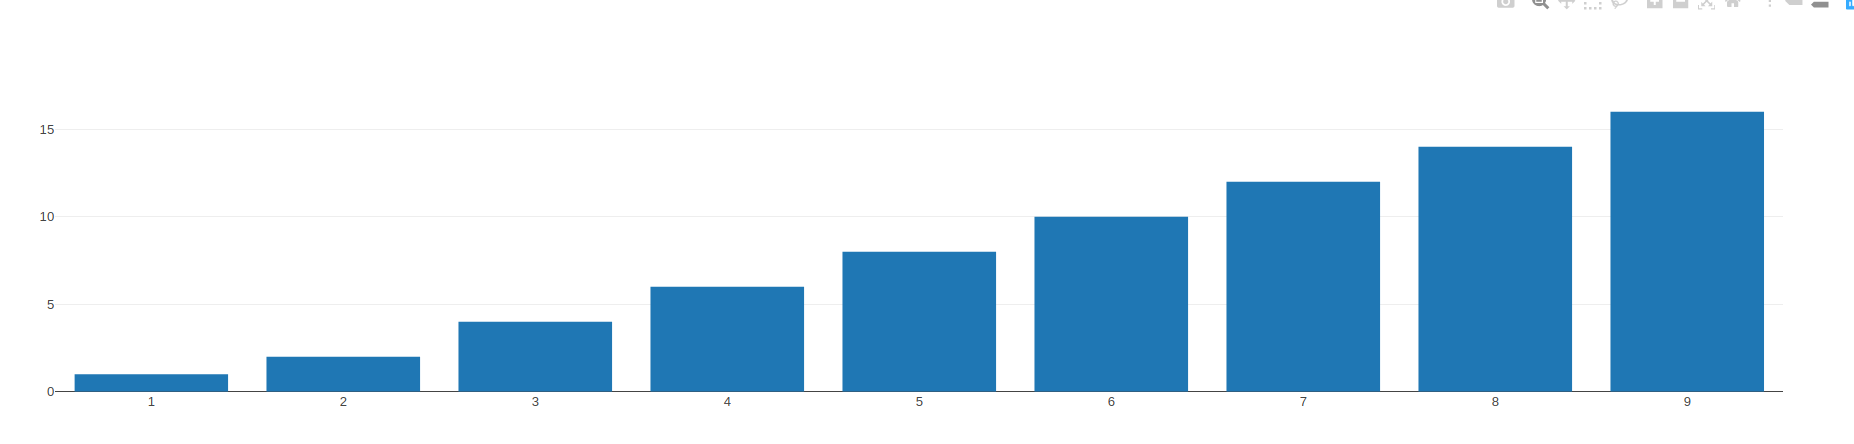
x: [1,2,3,4,5,6,7,8,9],
y: [1,2,4,6,8,10,12,14,16,18],
type:'bar'
}
];
Plotly.newPlot('myDiv',data);
where myDiv is the id of the HTML element you want the chart to be inserted in.
Giving us a very nice looking bar chart.
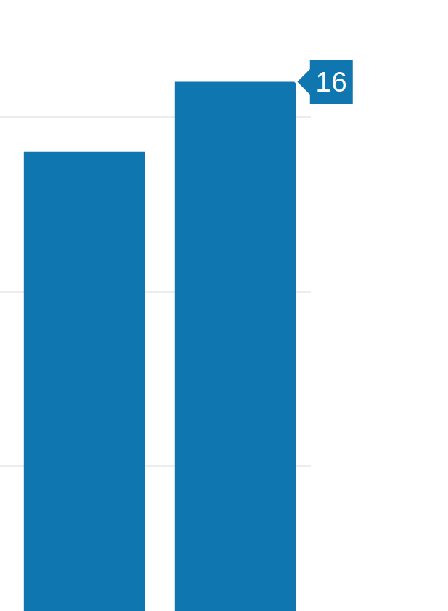
By default when you hover over a bar you will see its Y value on the bar. I needed to add a feature where the total amount + percentage needed to be shown, the amount also had to be prepended with a currency symbol (R).
Plotly has a number of configuration options. There are various was of going about this. To satisfy both requirements, hovertemplate will do the job for us.
var data = [
	{
	    x: [1,2,3,4,5,6,7,8,9,.....],
	    y: [1,2,4,6,8,10,12,......],
	    type:'bar',
		text: ["1", "12", "13",....],
		hovertemplate:'<i>R</i> %{y}<br>' +'%{text}%'
	}
    ];
    Plotly.newPlot('myDiv',data);
So the text field, which is our percentage values, adds additional text to the hover text, but we also needed to add the currency symbol as well, so the template configuration would do the trick for us.
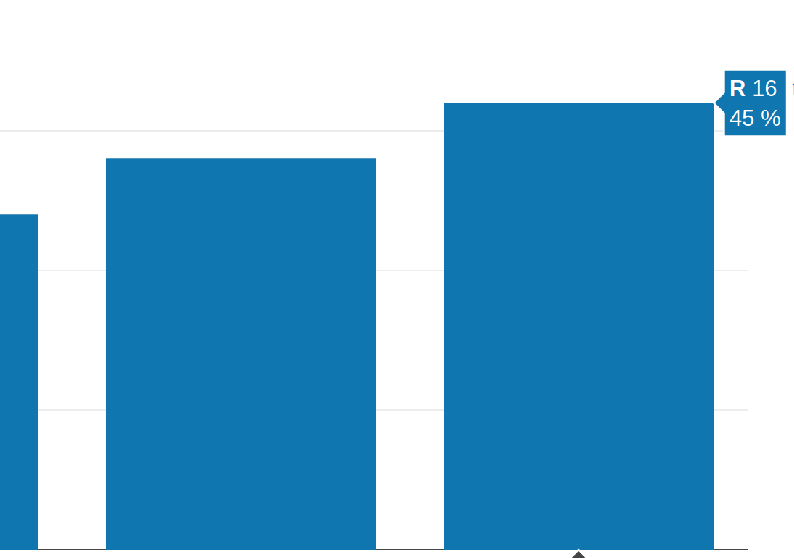
nice.